Clockwise Timesheets

My Analytics

Your hours over time and by charge code
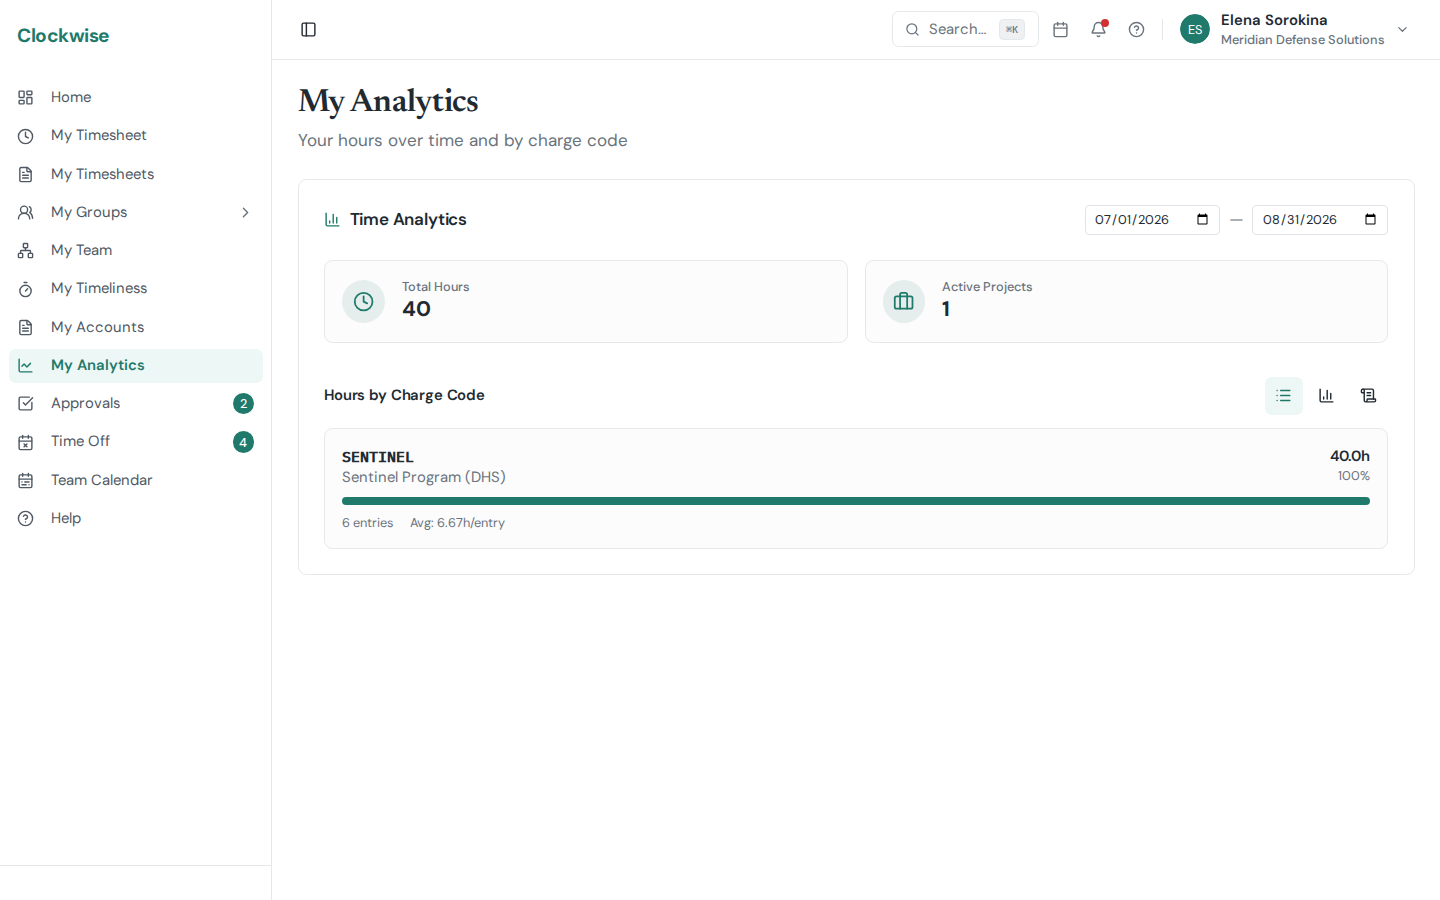
My Analytics. Total hours, active projects, and where your own time went — over any date range.

My Analytics is your personal view of the hours you've logged over time. It lives at the My Analytics entry in the left sidebar and is available to every user — you can always see your own data, no special role required.

What It Shows

  • Hours over time — a bar chart of your logged hours by day, week, or month, stacked by charge-code family so you can see the mix of work at a glance.
  • By charge code — your hours rolled up by charge code for the selected range.
  • Time log — a sortable list of the individual entries behind the totals.
  • Use the view toggle to switch between the chart, the breakdown, and the log, and adjust the date range to zoom in on a period.

    Where It Came From

    This is the same Time Analytics card that used to live on your Profile page. It now has its own top-level spot in the sidebar so it's easier to reach. Your Profile page is now focused on your work info, charge codes, leave balances, and notification preferences.

    Related Views

  • Managers see team-scoped charts on the Utilization tab of My Team and My Groups.
  • W-2 employees also get a billable-vs-available Utilization view.
  • Admins, owners, and finance get the company-wide cut on the Reports page.