Reports & Analytics
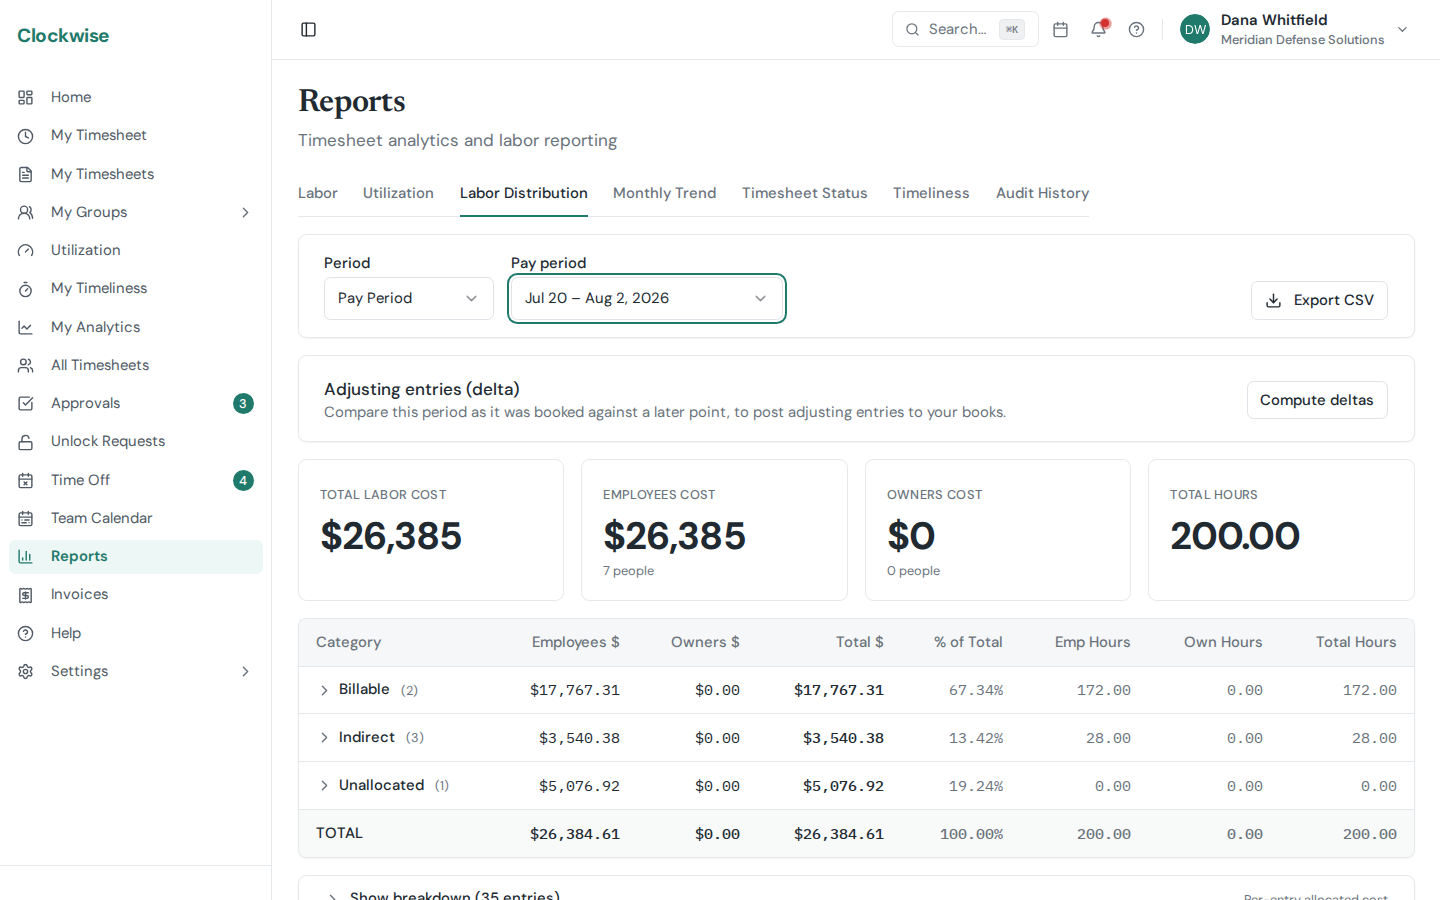
The Reports page is grouped into tabs, each focused on a different cut of the data. Admins, owners, and finance can all read every report.
Labor
The main labor view, driven by a Group by / then by pair of dimensions — charge code, employee, group, subcontractor, department, employment type, or date. One tab answers "hours by charge code", "hours by employee", "hours by employee within each group", and "each employee's total, expanded day by day" without hopping between separate reports. (This consolidates the former *By Charge Code*, *By Employee*, and *Labor Summary* reports.)
Picking Date on either side sorts the results chronologically instead of by hours; set it as the *then by* dimension to keep a row per employee (or charge code) that expands into its daily breakdown.
Three summary cards head the tab — total labor hours, employees with hours, and charge-code families — and the results render four ways via the view toggle:
Export offers two shapes: Summary (grouped) follows whichever dimensions you've picked, and All entries (detail) dumps the raw entries.
Utilization
Billable vs. available hours per user, by month or year. Highlights people running hot or sitting idle and is the basis for the personal My Analytics and Utilization views that employees see for themselves.
Labor Distribution
DCAA-style labor distribution: every user × every charge code in the period, covering direct and indirect (overhead, G&A, B&P) cost. Filter by charge-code type and individual codes; export to CSV for incurred-cost submissions. Available on the Pro and Enterprise plans.
Unallowable costs. FAR 31.201-6 unallowable hours still appear here — they're real costs and you still need to see them — but they're split into their own row within the family, labelled *(Unallowable)*, and the CSV export carries an Allowable column. That's what lets you exclude them from the indirect pools feeding your overhead and G&A rate calculations without losing the family attribution. Expanding either row drills into just the codes that made it up, so a drill-down always ties back to the row you opened. The adjusting-entry delta report splits the same way. Mark a code unallowable from Managing Charge Codes.
Adjusting entries (delta). The report always reflects current data, so re-running a past period after someone corrects their hours yields different numbers. To post only the *change* to your books, use Compute deltas: enter the date the numbers you already booked were exported, and the report reconstructs that snapshot (from timesheet edit history) and shows the per-project delta in dollars and hours — e.g. +$4,000 to Project A, −$4,000 to Project B. Because pay is reconstructed from effective-dated salary records rather than knowledge-dated ones, a delta will flag any employee whose salary data changed after the booked date, so you know that figure isn't purely a timesheet reallocation.
Monthly Trend
Month-over-month total hours, broken out by charge code family. Useful for spotting seasonality, ramp-up, or churn against a specific contract.
Timesheet Status
Lists timesheets that should exist for the period but are still in Draft (or not started) — this is the former "Missing Timesheets" tab. Pairs with the daily missing-time reminder from Settings → Notifications to keep the team current.
Periods. The presets (Last 2/4/8/12) show the most recently *completed* periods — the current one is left out, since nobody is late on a period that's still open. Choose Custom… to name a From/To date range instead: every period overlapping those dates is shown, including the in-progress one, so you can look back at a closed quarter or check where the open period stands. A range wider than 26 periods shows the 26 most recent.
Timeliness
Per-employee on-time vs. late day rates over a date range, plus a count of days revised after the deadline, expandable into the per-day detail (hours recorded, how many were in by the deadline, first filed, deadline, hours late, and the charge-code lines behind the day). The same engine drives the personal My Timeliness view and the Timeliness tab on My Team / My Groups — this is the company-wide cut. See Timeliness for what counts as on time.
Audit History
Timeline of every timesheet event — submission, approval, rejection — with user, timestamp, and (for rejections) the reason. Filter by employee, date range, or action type. This is the report DCAA auditors usually want to see.
Filtering and Export
Every report supports an employee filter and a date range. Most reports have an Export CSV button at the top right; the Audit History export includes the rejection reason field.